এখন থেকে আমরা Elev8
আমরা শুধুমাত্র একটি ব্রোকার নই। আমরা একটি সর্বাত্মক ট্রেডিং ইকোসিস্টেম—বিশ্লেষণ, ট্রেড, এবং প্রবৃদ্ধির জন্য আপনার যা কিছু প্রয়োজন তা এক জায়গায়। আপনার ট্রেডিং উন্নত করতে প্রস্তুত?
আমরা শুধুমাত্র একটি ব্রোকার নই। আমরা একটি সর্বাত্মক ট্রেডিং ইকোসিস্টেম—বিশ্লেষণ, ট্রেড, এবং প্রবৃদ্ধির জন্য আপনার যা কিছু প্রয়োজন তা এক জায়গায়। আপনার ট্রেডিং উন্নত করতে প্রস্তুত?
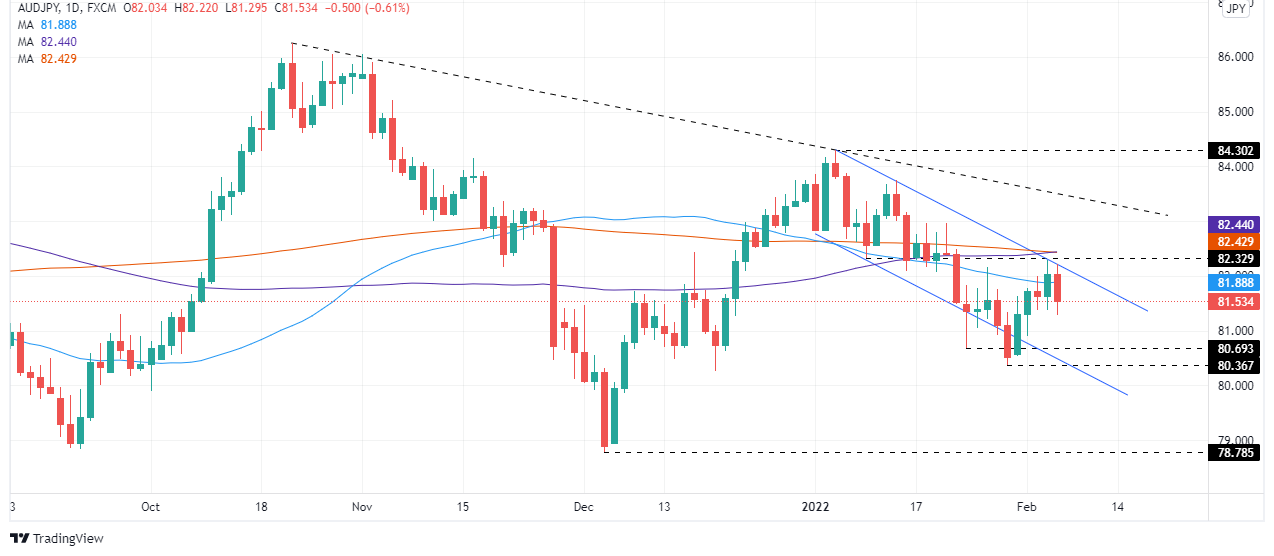
The AUD/JPY slides for the second time in the week, and from a technical perspective, it is forming a tweezers-top candle chart pattern, retreating from weekly tops around 82.27 to the 81.50s region. At the time of writing is trading at 81.55.
AUD/JPY daily chart, shows that Friday’s price action in the Asian session seesawed around the daily pivot point and February 3 daily high, at 81.89 and 82.27, respectively. However, during the European session, dampened market mood conditions spurred a drop towards 81.32 for a 90-pip fall, stabilizing around the S1 daily pivot at 81.51.
That said, the AUD/JPY remains neutral-bearish biased. Friday’s price action witnessed a downward break of the 50-day moving average (DMA) at 81.58. In the event of a daily close below of it, that will confirm the tweezers-top, which could fuel another leg-down before confirming a bottom.
The AUD/JPY first support would be the February 1 low at 80.89. A downward break would expose the confluence of a bottom-trendline of a bullish-flag and the January 28 daily low at 80.36, followed by the psychological 80.00 barrier.