Kể từ bây giờ chúng tôi là Elev8
Chúng tôi không chỉ là một nhà môi giới. Chúng tôi là một hệ sinh thái giao dịch tất cả trong một—mọi thứ bạn cần để phân tích, giao dịch và phát triển đều có ở một nơi. Sẵn sàng nâng tầm giao dịch của bạn?
Chúng tôi không chỉ là một nhà môi giới. Chúng tôi là một hệ sinh thái giao dịch tất cả trong một—mọi thứ bạn cần để phân tích, giao dịch và phát triển đều có ở một nơi. Sẵn sàng nâng tầm giao dịch của bạn?
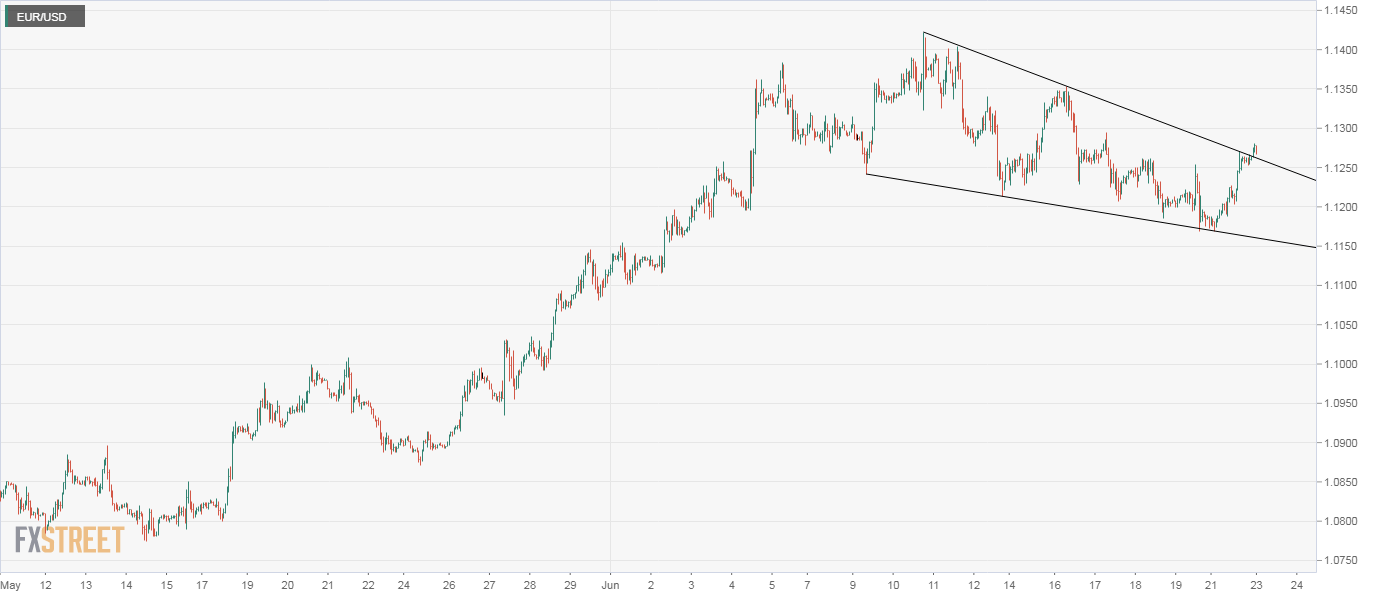
EUR/USD jumped to 1.1280 during Tuesday's Asian session, extending Monday's 0.78% gain and confirming a falling wedge breakout on the hourly chart.
A falling wedge comprises converging trendlines connecting lower highs and lows. The converging nature of trendlines indicates bearish exhaustion. Hence, a breakout is considered a bullish reversal pattern.
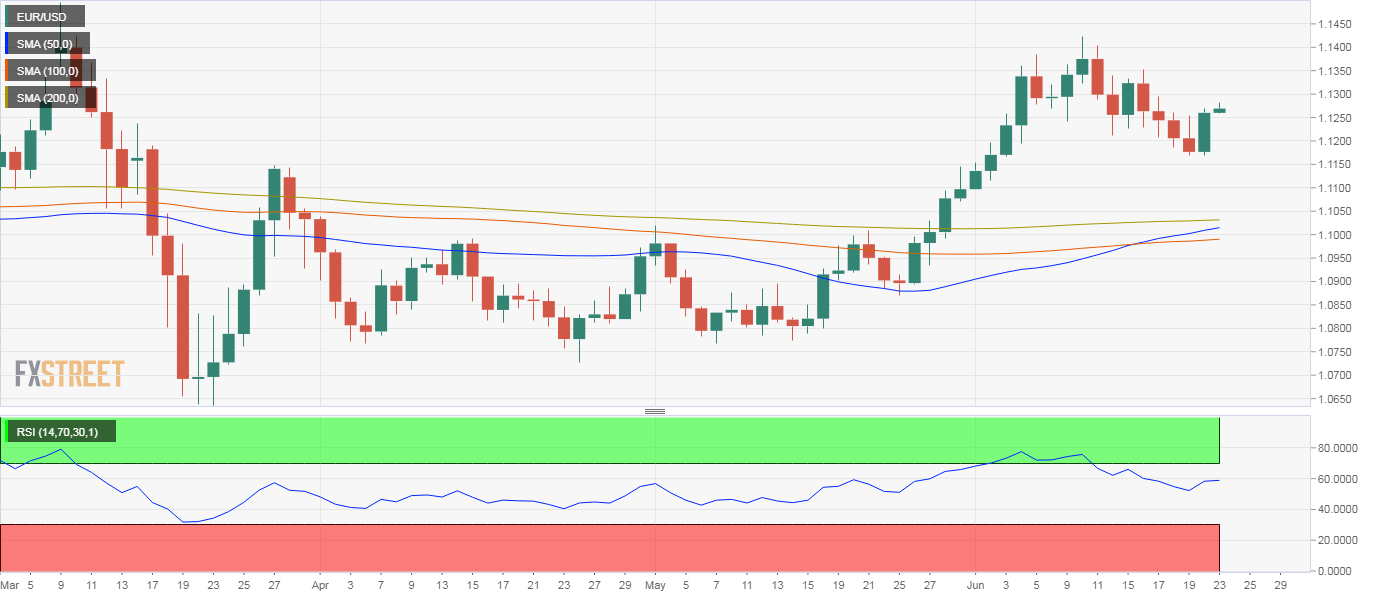
Put simply, EUR/USD's falling wedge breakout indicates that the pullback from the June 10 high of 1.1422 has ended and the rally from the May 14 low of 1.0775 has resumed. The wedge breakout is backed by an above-50 reading on the 14-day relative strength index, a bullish cross of the 50- and 100-day simple moving averages (SMAs), and an impending golden cross of the 50- and 100-day SMAs.
The pair may face resistance at 1.1353 (June 16 high), which, if breached, would expose 1.1422.
The bullish bias would weaken if the pair finds acceptance under Monday's low of 1.1168. At press time, the pair is trading at 1.1268.
Trend: Bullish