Kể từ bây giờ chúng tôi là Elev8
Chúng tôi không chỉ là một nhà môi giới. Chúng tôi là một hệ sinh thái giao dịch tất cả trong một—mọi thứ bạn cần để phân tích, giao dịch và phát triển đều có ở một nơi. Sẵn sàng nâng tầm giao dịch của bạn?
Chúng tôi không chỉ là một nhà môi giới. Chúng tôi là một hệ sinh thái giao dịch tất cả trong một—mọi thứ bạn cần để phân tích, giao dịch và phát triển đều có ở một nơi. Sẵn sàng nâng tầm giao dịch của bạn?
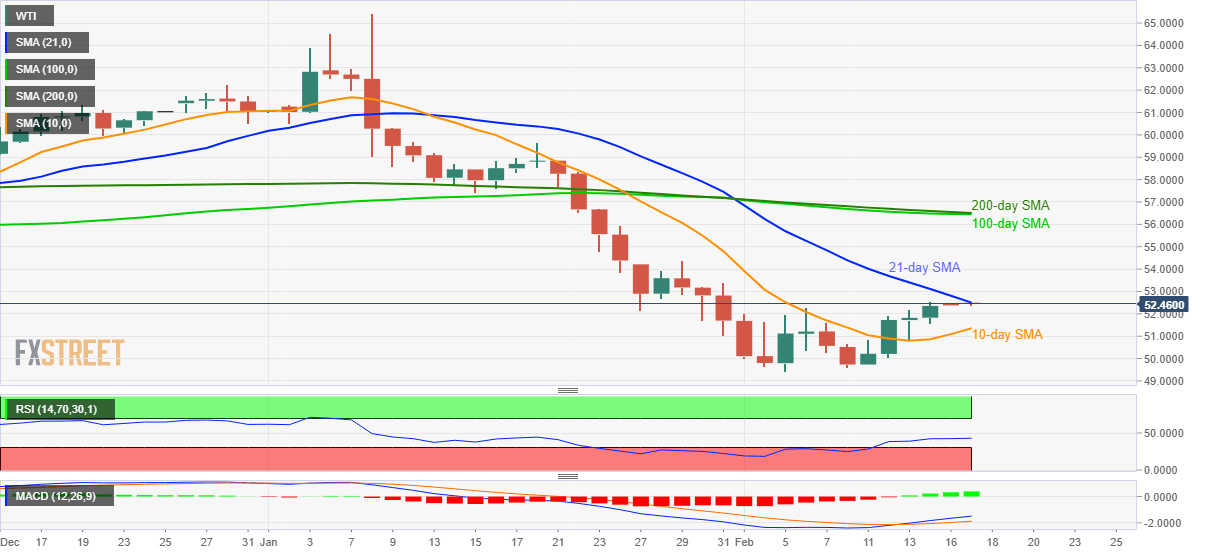
WTI slips from the monthly top to $52.40 during Monday’s Asian session. In doing so, the pair confronts short-term resistance while staying above the 10-day SMA. Also favoring the buyers are technical indicators like MACD and RSI.
With this, buyers will look for entry beyond a 21-day SMA level of $52.50 while targeting January 29 high near $54.40.
It should, however, be noted that a confluence of 100-day and 200-day SMAs near $56.45/50 will be the key upside barrier to watch during the black gold’s rise past-$54.40.
Meanwhile, a 10-day SMA level near $51.35 could restrict the energy benchmark’s short-term declines.
In the case where oil prices keep trading southwards below $51.35, $50.00 and the monthly bottom surrounding $49.40 should be watched carefully.
Trend: Further recovery expected