Kể từ bây giờ chúng tôi là Elev8
Chúng tôi không chỉ là một nhà môi giới. Chúng tôi là một hệ sinh thái giao dịch tất cả trong một—mọi thứ bạn cần để phân tích, giao dịch và phát triển đều có ở một nơi. Sẵn sàng nâng tầm giao dịch của bạn?
Chúng tôi không chỉ là một nhà môi giới. Chúng tôi là một hệ sinh thái giao dịch tất cả trong một—mọi thứ bạn cần để phân tích, giao dịch và phát triển đều có ở một nơi. Sẵn sàng nâng tầm giao dịch của bạn?
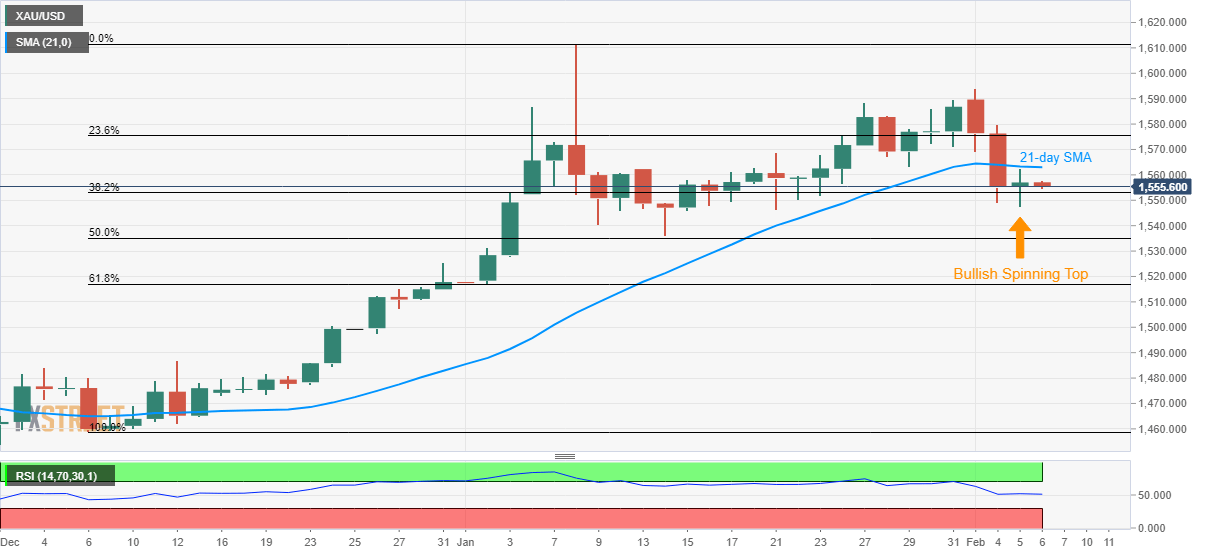
Gold prices step back to $1,555.50 during Thursday’s Asian session. In doing so, the yellow metal stays below 21-day SMA despite portraying a bullish candlestick formation the previous day.
As a result, the bullion needs to cross a 21-day SMA level of $1,563 to justify the bullish spinning top and aim for 23.6% Fibonacci retracement of December 2019 to January 08 upside near $1,575.
In a case where the quote manages to stay positive above $1,575, it’s the run-up to the monthly top surrounding $1,594 and $1,600 round-figure can’t be ruled out.
Alternatively, $1,536/35 area including January 14 low and 50% Fibonacci retracement limits the precious metal’s near-term declines.
Should there be a downside below $1,535, the yearly bottom close to 61.8% Fibonacci retracement, at $1,517, will gain the bear’s attention ahead of $1,500 mark.
Trend: Sideways