अब से हम Elev8 हैं
हम केवल एक ब्रोकर नहीं हैं। हम एक ऑल-इन-वन ट्रेडिंग इकोसिस्टम हैं—आपको विश्लेषण करने, ट्रेड करने और बढ़ने के लिए जो कुछ भी चाहिए, वह एक ही स्थान पर है। क्या आप अपने ट्रेडिंग को ऊँचा उठाने के लिए तैयार हैं?
हम केवल एक ब्रोकर नहीं हैं। हम एक ऑल-इन-वन ट्रेडिंग इकोसिस्टम हैं—आपको विश्लेषण करने, ट्रेड करने और बढ़ने के लिए जो कुछ भी चाहिए, वह एक ही स्थान पर है। क्या आप अपने ट्रेडिंग को ऊँचा उठाने के लिए तैयार हैं?
USD/CAD trades modestly positive around 1.3245 ahead of the European session on Monday. In doing so, the quote seesaws near the strongest in 2020 while also challenges a downward sloping trend line since May 31, 2019. However, RSI conditions are nearly overbought.
As a result, the bulls will wait for entry on the daily closing beyond the 1.3245 resistance line. With that, 61.8% Fibonacci retracement of the pair’s declines from May 2019 to January 2020, at 1.3315, will be on the buyer’s radar.
In a case, the USD/CAD prices fail to close beyond 1.3245 on a daily closing basis, sellers will not cheer the performance as 200-day SMA and 50% Fibonacci retracement, near 1.3230, challenges the bears.
On the break of 1.3230, a 100-day SMA level of 1.3178 and 38.2% Fibonacci retracement near 1.3150 could please the sellers.
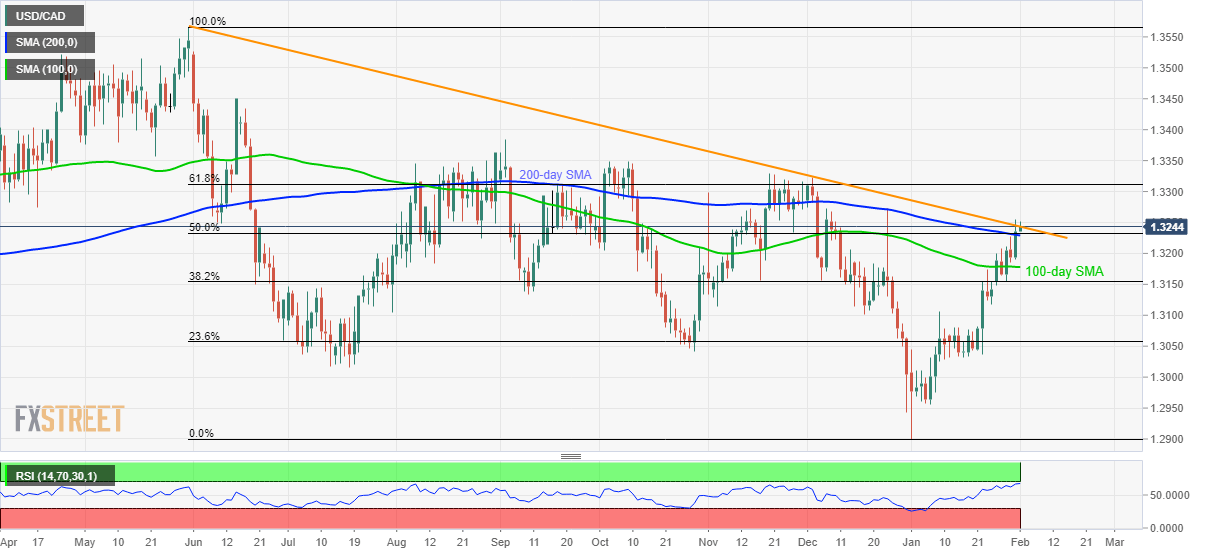
Trend: Bullish