اب سے ہم Elev8 ہیں
ہم صرف ایک بروکر نہیں ہیں۔ ہم ایک جامع ٹریڈنگ ایکوسسٹم ہیں—ہر چیز جو آپ کو تجزیے، ٹریڈ اور ترقی کے لیے درکار ہو، ایک ہی جگہ پر ہے۔ کیا آپ اپنی ٹریڈنگ کو بلند کرنے کے لیے تیار ہیں؟
ہم صرف ایک بروکر نہیں ہیں۔ ہم ایک جامع ٹریڈنگ ایکوسسٹم ہیں—ہر چیز جو آپ کو تجزیے، ٹریڈ اور ترقی کے لیے درکار ہو، ایک ہی جگہ پر ہے۔ کیا آپ اپنی ٹریڈنگ کو بلند کرنے کے لیے تیار ہیں؟
Gold remains on the back foot while trading around $1,556.90 during the Asian session on Wednesday. The yellow metal portrayed a bearish candlestick formation, backed by bearish MACD, during the previous day.
As a result, the bullion’s prices are likely to decline further towards 38.2% Fibonacci retracement of its November-January rise, at $1,547, ahead of testing 21-day SMA level of 1,542.55.
During the precious metal’s downside past-21-day SMA, 50% of Fibonacci retracement and November month high could please sellers around $1,528 and $1,515.
Alternatively, a daily closing beyond Tuesday’s high near $1,569 will defy the bearish sipping top and can push the quote to 23.6% of Fibonacci retracement around $1,572.
Given the buyers' ability to stay strong above $1,572, $1,587 holds the key to further rise targeting the monthly top surrounding $1,611.
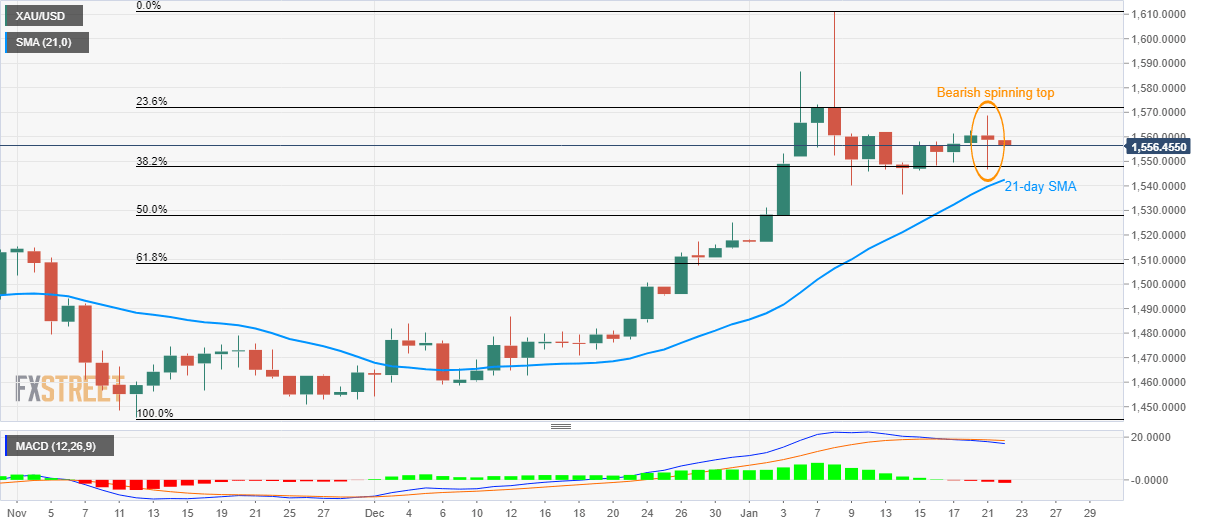
Trend: Pullback expected