अब से हम Elev8 हैं

हम केवल एक ब्रोकर नहीं हैं। हम एक ऑल-इन-वन ट्रेडिंग इकोसिस्टम हैं—आपको विश्लेषण करने, ट्रेड करने और बढ़ने के लिए जो कुछ भी चाहिए, वह एक ही स्थान पर है। क्या आप अपने ट्रेडिंग को ऊँचा उठाने के लिए तैयार हैं?
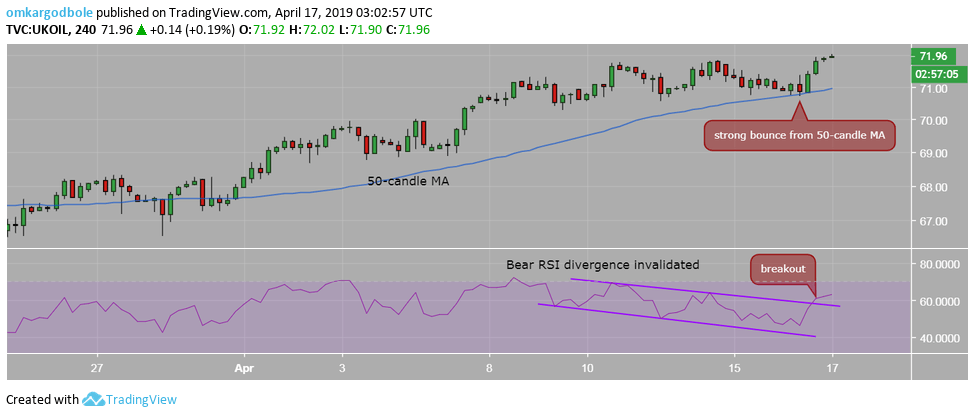
Brent Technical Analysis: Bearish 4H RSI divergence invalidated

  • Brent oil dropped to 4-hour chart 50-candle moving average (MA) yesterday, as expected, only to stage a strong bounce and close above $71.70 engulfing Monday's price action.
  • The resulting bullish outside day candle is a bullish continuation pattern and has invalidated the bearish divergence of the 4-hour chart relative strength index (RSI).
  • More importantly, the indicator has violated the lower highs (bearish divergence) with a falling channel breakout.
  • Brent, therefore, could rise to $72.80 (61.8 percent Fibonacci retracement of $86.71/$50.29).
  • The bullish case, however, would weaken if the prices fall back below the 5-day moving average (MA), currently at $71.50.

4-hour chart

Daily chart

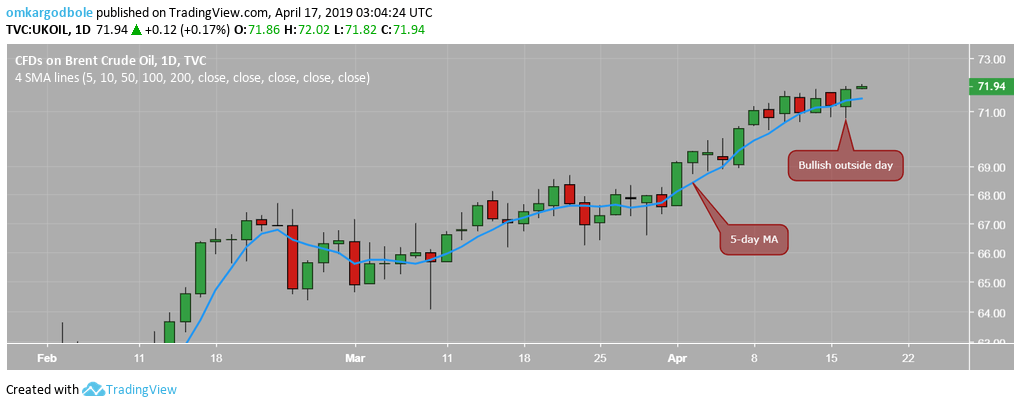
Trend: Cautiously bullish


BHP cuts iron ore production outlook, will it help boost iron-ore prices, Aussie?

BHP Group, the world’s biggest miner, announced on Wednesday that it slashed its forecast for iron ore output after a tropical Australian cyclone, Reu
अधिक पढ़ें Previous

RBNZ inflation data steadies at 1.7% y/y in Q1 2019

The Reserve Bank of New Zealand (RBNZ) is out with its inflation data for the March quarter, with the figures coming in at 1.7% y/y vs. 1.7% previous.
अधिक पढ़ें Next