এখন থেকে আমরা Elev8
আমরা শুধুমাত্র একটি ব্রোকার নই। আমরা একটি সর্বাত্মক ট্রেডিং ইকোসিস্টেম—বিশ্লেষণ, ট্রেড, এবং প্রবৃদ্ধির জন্য আপনার যা কিছু প্রয়োজন তা এক জায়গায়। আপনার ট্রেডিং উন্নত করতে প্রস্তুত?
আমরা শুধুমাত্র একটি ব্রোকার নই। আমরা একটি সর্বাত্মক ট্রেডিং ইকোসিস্টেম—বিশ্লেষণ, ট্রেড, এবং প্রবৃদ্ধির জন্য আপনার যা কিছু প্রয়োজন তা এক জায়গায়। আপনার ট্রেডিং উন্নত করতে প্রস্তুত?
USD/IDR trades near 14,100 during early Monday. The quote dropped beneath 50-day simple moving average (SMA) for the first time in a month on Friday.
While the break of 50-day SMA favors the odds for further decline, 23.6% Fibonacci retracement of December 26 to February 05 downside, surrounding the March month low of 14,056 could challenge the sellers.
In a case, prices slip beneath 14,055, 14,000 and February 25 low near 13,970 may offer intermediate halt to the downside towards the year’s low around 13,950.
Meanwhile, 50-day SMA level of 14,140 can act as an immediate upside barrier, a break of which can recall 14,120 and 100-day SMA level of 14,235 on the chart.
Should there be additional rise past-14,235, a downward sloping trend-line since March could question Bulls near 14,300.
USD/IDR daily chart
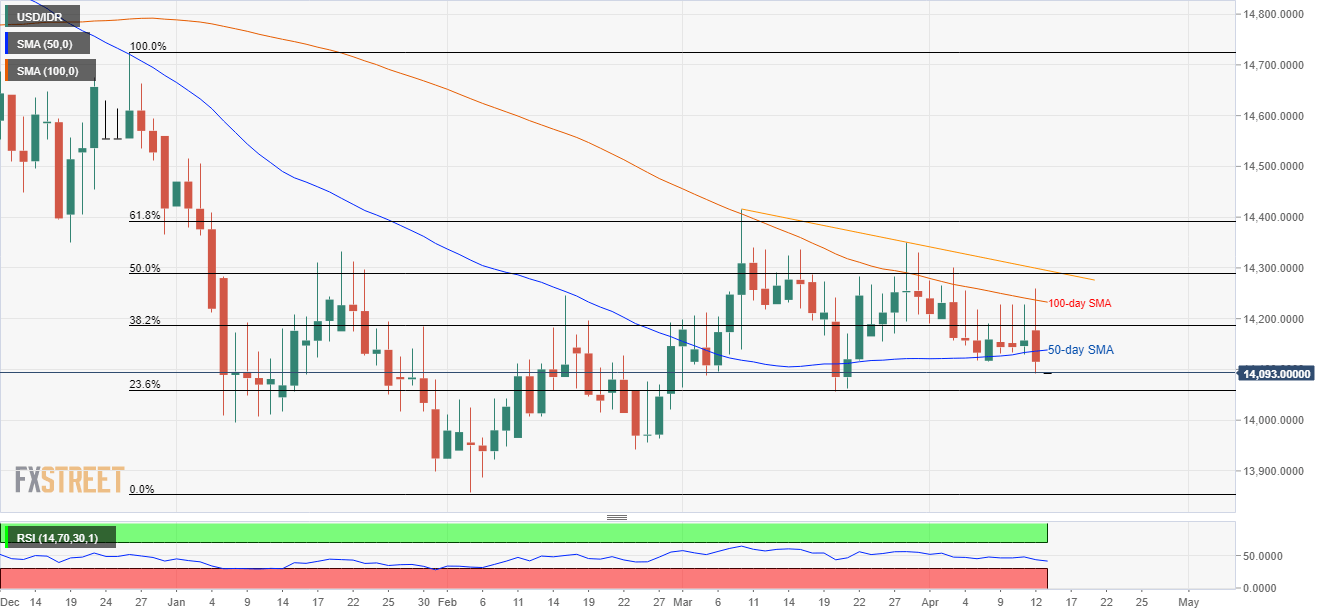
Trend: Bearish