अब से हम Elev8 हैं
हम केवल एक ब्रोकर नहीं हैं। हम एक ऑल-इन-वन ट्रेडिंग इकोसिस्टम हैं—आपको विश्लेषण करने, ट्रेड करने और बढ़ने के लिए जो कुछ भी चाहिए, वह एक ही स्थान पर है। क्या आप अपने ट्रेडिंग को ऊँचा उठाने के लिए तैयार हैं?
हम केवल एक ब्रोकर नहीं हैं। हम एक ऑल-इन-वन ट्रेडिंग इकोसिस्टम हैं—आपको विश्लेषण करने, ट्रेड करने और बढ़ने के लिए जो कुछ भी चाहिए, वह एक ही स्थान पर है। क्या आप अपने ट्रेडिंग को ऊँचा उठाने के लिए तैयार हैं?
GBP/USD finally breached the 50-DMA to the downside in a convincing manner on Tuesday and extended losses in Asia to an 8-week low of 1.2805 levels. The downside break of the recent trading range of 1.2830-1.2920 marks the continuation of the sell-off from the recent high of 1.3268.
However, the one-month 25-delta risk reversal remained unchanged at -0.60 on Tuesday, which means the demand for Puts did not increase despite the downside break of the trading range.
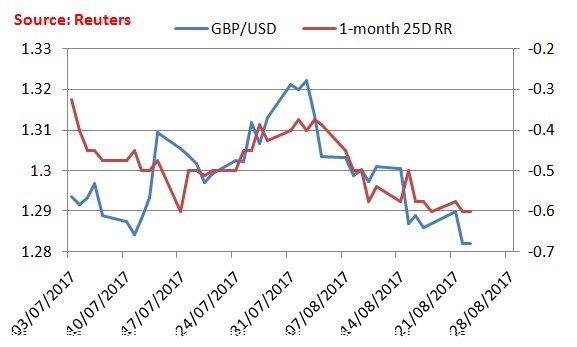
Furthermore, the US-UK 10-year yield spread remains stuck in a falling channel pattern. Thus, bears need to observe caution.

A technical breakdown would look more convincing if accompanied by an upside break on the yield spread chart and drop in the risk reversal below -0.60 [that would be lowest since June 26].
GBP/USD Technical Levels
Valeria Bednarik, Chief Analyst at FXStreet, writes, “from a technical point of view, the downside remains favored, given that in the 4 hours chart, the 20 SMA began gaining downward momentum above the current level, whilst technical indicators hold within bearish territory, with the RSI indicator already gyrating south around 35. A bearish extension through 1.2810 should favor an approach to the 1.2700/20 region, where the pair presents multiple relevant daily highs and lows from earlier this year.”