Kể từ bây giờ chúng tôi là Elev8
Chúng tôi không chỉ là một nhà môi giới. Chúng tôi là một hệ sinh thái giao dịch tất cả trong một—mọi thứ bạn cần để phân tích, giao dịch và phát triển đều có ở một nơi. Sẵn sàng nâng tầm giao dịch của bạn?
Chúng tôi không chỉ là một nhà môi giới. Chúng tôi là một hệ sinh thái giao dịch tất cả trong một—mọi thứ bạn cần để phân tích, giao dịch và phát triển đều có ở một nơi. Sẵn sàng nâng tầm giao dịch của bạn?
USD/JPY could be overshooting the upper boundary line of a Broadening Formation (BF) price pattern that looks like it has been forming over the last three weeks.
BFs develop when price starts to go sideways but forms higher highs and lower lows with each leg of the unfolding range.
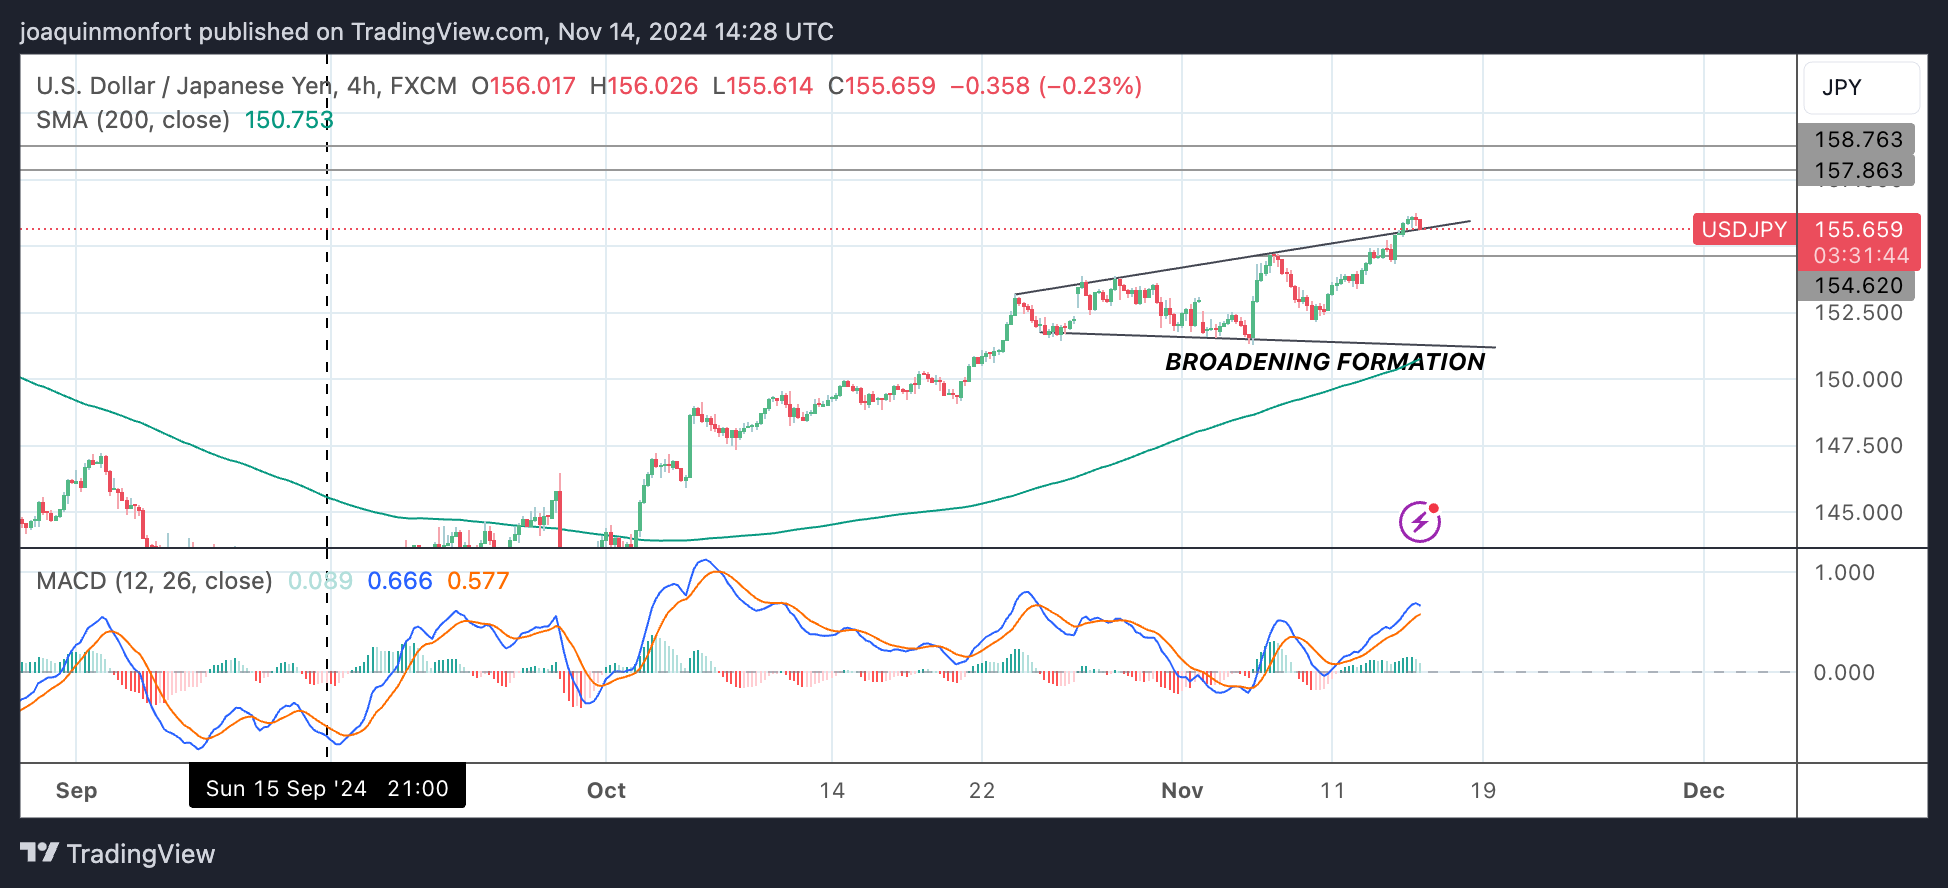
BFs occur during periods of high market volatility as has been the case during the formation of the one on USD/JPY which coincides with the US presidential election.
At a price top the pattern is a sign of a bearish reversal, with an eventual decline below the lower boundary line.
Assuming USD/JPY has formed the pattern, it has just overshot the upper boundary line. This could either mean the pattern is invalid or not. It is possible the overshoot is a sign of exhaustion and that the price will soon start to decline back down to the lower boundary line at around 151.30. A break below 1.5460 (November 6 high) would probably confirm such a decline.
If the (blue) Moving Average Convergence Divergence (MACD) momentum indicator crosses below its red signal line that will add further weight of evidence to the bearish thesis.
Eventually price is likely to break below the lower boundary line and start an even deeper decline. If so, it is likely to fall to a point equal to the width of the pattern at its broadest point extrapolated lower.
Alternatively, the pattern may be false and USD/JPY could still be in a strong short and medium-term uptrend. If so, given the principle that “the trend is your friend” it will probably continue higher once the current pullback ends.
In such a case, a break above 156.25 would likely confirm further upside towards a target at around 157.86 (July 19 high).